MASSIVE CHANGES IN TRADITIOnal land use IN oil consession
block
5A
- The
oil
fields of Sudan / Southern Sudan -
Files, links and pdf are found in the button of this page
A multi-temporal study of the
oil concession block 5A revealed massive changes in the traditional farming
pattern since the introduction of oil industry.
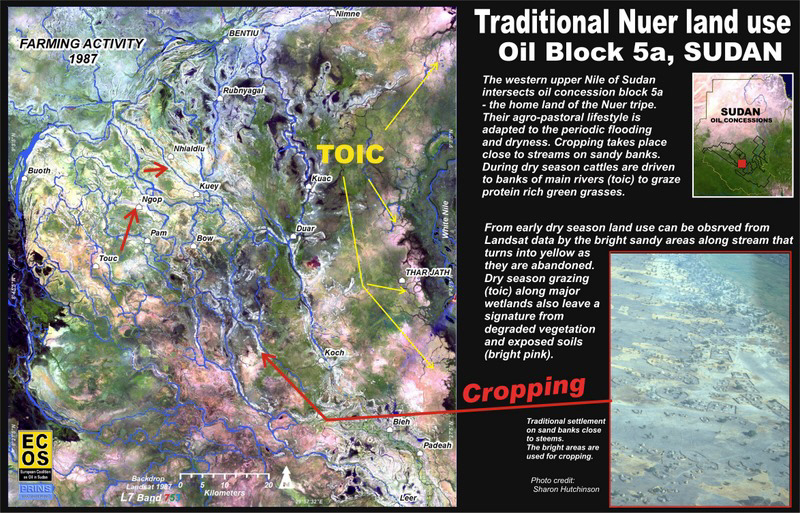
Particular in the period between 1999-02 massive changes was shown from Landsat
data which was recorded at the time of the year when the traditional farming are
concentrated around the homesteads. The active farming from primarily harvesting
activity and high livestock concentrations left a footprint that are known from
range land farming systems. This natural resource utilization leaves a high
reflectance which can be linked to the presence of people. The pattern of
change closely collaborated with massive reporting's of fighting and
displacement of people in the area.
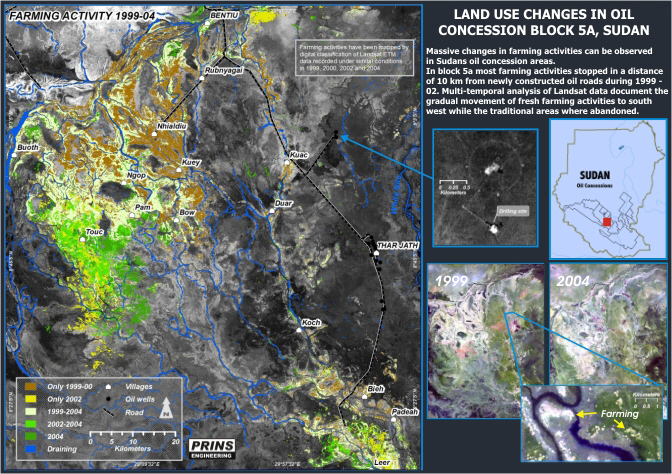
Change in land use in the period 1999-04. During 2002 almost
no land use activity (farming activity) could be observed around Nhialdiu. An
increased in farming activity could, however be observed around Touc and south
of.
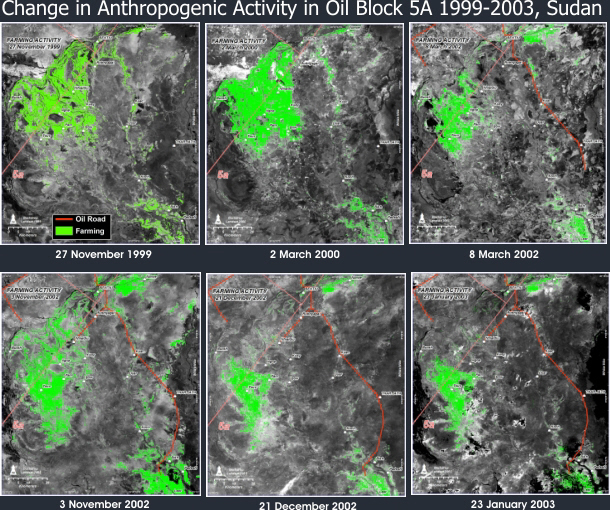
Change in farming activity in Block 5A from 1999 to spring
2003, during this period most observed farming activity was moved away from
areas of the expanding oil industry.
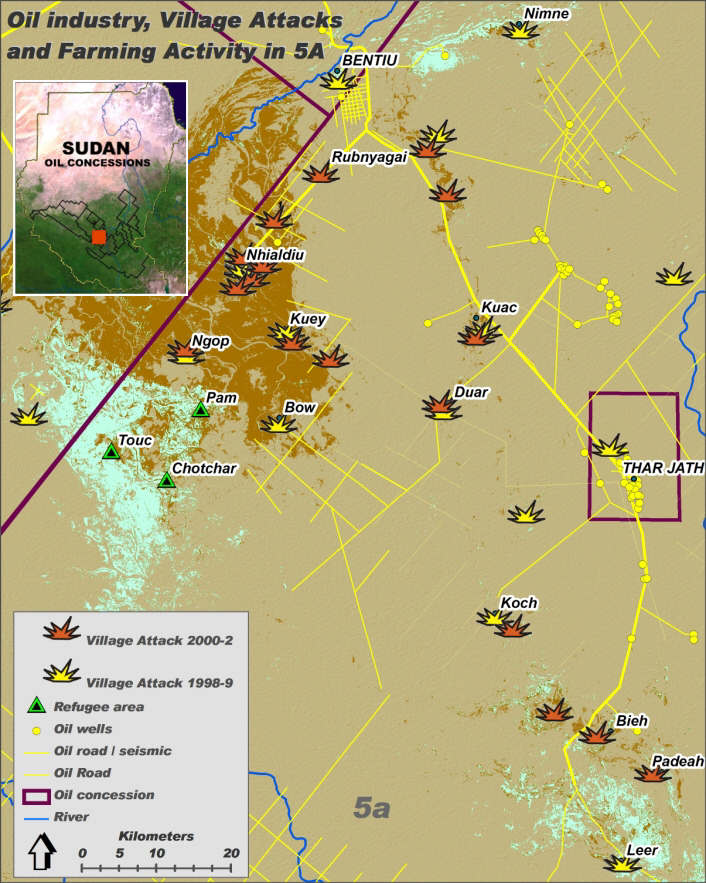
Change in farming activity in the period
2000-2 and plot of village attacks (recorded from literature). Brown refers to
areas which were observed as farming areas in 2000 but not in late 2002. Pale
green observed farming areas in late 2002 which co-responded with reported
refugee areas.
Summery from peer-reviewed scientific publication in International Journal of
Remote Sensing.
Covering
land use changes in two periods 1999-2002 and 2014-2015
Prins (2018):
During 2013-15 the 5a area was exposed
to more humanitarian suffering. This was apparently watched by international
organisations as a huge amount VHR data was available on Google Earth. This
allowed a more comprehensive evaluation of the Landsat potential for mapping the
footprint and changes in the agro-pastoral way of life.
Very High Resolution (VHR) satellite
data was used to evaluate the prediction of farming activity, which was
characterized like the description as in the Prins 2009 report (Table 1; Prins
2018). However, the lower bound of farming activity was set to 10% of a Landsat
pixel, as the target was settlement areas and close surroundings and below this
threshold interpretation of VHR data was considered to be linked with
unacceptable uncertainties.
Table
1. Farming activity class definition and means to verification by VHR imagery.
The key Landsat data (table 2) was
again chosen from early dry / harvest period where farming activity are
concentrated around the homesteads - thus, if present, will show a footprint
like monitoring the pioshere in rangeland management.
Table 2. Landsat data used in International Journal of Remote Sensing
publication (Prins 2018) included two essential images from the Prins 2009
report. The images are requested in early dry season that is best for rangeland
monitoring and in this case are when people have been gathered at homesteads for
crop harvest.
The five Landsat images were
calibrated to ToA and intercalibrated using invariant points, with a few
exceptions reached a remarkably close intercalibration that allow multitemporal
monitoring. Surface Reflectance (SR) that is a product that have under
development over the past decade showed a similar result. SR is useful as it
corrects for uneven atmosphere and can now be
acquired pre-processed for free. The uneven atmosphere is typically affecting
visible blue band, but Blue did not show channelling to calibrate for the time
series analysis. This was found both in Prins (2018) (see table 3 below. table 4
in Prins 2018) and in the imagery shown in Stockholm 2013 presentation that were
calibrated independently.
Table
3. Mean difference between spectral bands after inter-calibration (from Prins
2018).
The most successful farming activity
predictor was the machine learning algorithm MaxEnt, which is traditionally used
in ecology for species prediction (Phillips et al 2006). However, so far, the
remote sensing community has only given it limited attention. In this case it
outperformed all other traditional remote sensing classifiers. MaxEnt showed
outstanding predictability and consistency across all years - apart from the NiR
band. This could be expected as farming areas in this environment could include
a range of factors that include bare areas, differences in soils, green
vegetation, and moisture, which NiR is sensitive to.
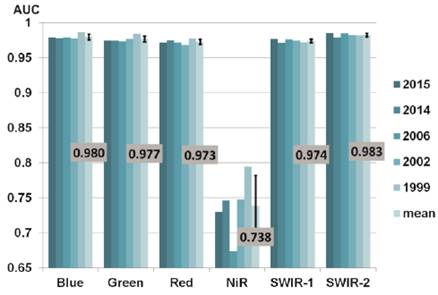
Figure
1. AUC values
of
individual Landsat bands produced by MaxEnt for each year and mean of all years
including SD - apart from NiR band it shows remarkably high consistency and thus
high reliability for multitemporal prediction and mapping.
A comprehensive analysis of
classifications algorithms as well as spectral bands and indices was preformed
from both the 2014 and 2015 image. The predictability of farming activity from
MaxEnt showed very strong across indices.
The strongest response collaborated
findings from recent years remote sensing research in rangeland management (fig
2). SWIR band 2 and furthermore indices of the Normalized Difference Tillage
Index (NDTI), Normalized Difference Infrared Index 7 (NDII7) as well as the Soil
Adjusted Total Vegetation Index (SATVI) showed strongest – they are considered
state of art indices for rangeland management. However, Blue band and SWIR 2
showed for both test years to independently produce among the highest overall
mapping accuracy > 97% (see Prins 2018 paper or indicated by the debated Kappa
coefficient of approximately 0.85). MaxEnt using all bands and Tassel caps
outperformed all other methods with overall mapping
accuracy > 98.5% (Kappa 0.88-0.92). The ISO classifier produced overall
mapping accuracy > 97.2% (Kappa 0.81-0.86) that outperformed most categorical
classifiers. However, it should be noted that the uncertainties with ISO
classifier was linked with commission errors. Or more specially it made the
farming areas larger which indicates it grabbed farming activity below the 10%
threshold used in the evaluation by interpreting VHR images -see below.
Figure
2. AUC values produced by MaxEnt for individual Landsat bands and indices show
very high explaining ability, particular for indices and bands that have found
useful for Rangeland management.
When the farming prediction from
MaxEnt was put together as a standardized difference image (2014–2015),
depopulated or change areas could be identified at both settlement and state
levels. As shown in Figure 3 (b), there has been a significant decrease in
farming activity along the main roads as well as in the east central part of the
study area. This includes the Ngop area that has been documented by
UNOSAT (2015) as burnt
and the larger Boaw area that was reported to be severely terrorized and
destroyed in 2015 (Aljazeera 2015; HRW 2015; UNOSAT 2016). Interpreting a no
comprehensive mapping from Boaw area (Figure 3b) in Google Open Street Maps
(2015) shows approximately 1500 housing structures and with average of 5 persons
in a household (personal communication Nils Carstensen, Christian Aid), this can
bring up realistic estimates of 10,000 people being driven off their land in the
Boaw area in 2015. The Landsat change product shows a similar overall pattern as
the UNOSAT (2016) VHR-based product of destroyed housing structures. However, it
covers a much larger area, and allows identification of specific destroyed
settlements (Figure 4). In addition to the massive disturbance east of Ngop and
Boaw, the Landsat change analysis showed large scale increased farming intensity
in and around major towns of Bentiu, Koch, and Leer. According to ground reports
(HRW 2015; UNHRC 2016) , these areas have received high amount of displaced
people as well as cattle in 2015. This is difficult to observe or derive from
VHR imagery. UNOSAT (2016) uses direct observation of cattle which only
represents a snapshot of the situation, compared to the Landsat analysis that
captures the intensity of the farming activity that had occurred.
Therefore, Landsat data can be a
better choice for capturing piosphere or anthropogenic activity than the use of
VHR imagery. This has analogy to evaluation of burnt areas where interpretation
of Landsat data can be a better choice than VHR imagery (Sparks et al. 2015).
Overall, these results suggest that Landsat data not only can be an effective
supplement to VHR imagery but a more effective choice to produce regional
overviews that allow evaluation down to the settlement level. However, it can
also retrieve essential information that is not captured or cannot be
interpreted by using VHR imagery.
Producing a similar MaxEnt
standardized difference image for the 1999–2002 data (see Figure (a)) uncovers a
massive change in farming activity that closely collaborated Prins earlier work
and ground reports (e.g., HRW 2003; de Guzman 2002 - see also hand drawn map
herein; Christian Aid 2002) of massive human abuses that depopulated the
Nhialdiu area in February 2002. Inserted in Figure 3 (a) are also attacked
villages and refugee campsites that were geo-located from the reports.
Furthermore, in transparent, the extent of the 2002 attack interpreted from
reports and hand drawn maps (de Guzman 2002; Christian Aid 2002) that were
reported depopulated in late 2002. This could again be shown by the MaxEnt
change detection product (e.g., SD < −2.5) that inferred the decrease in farming
activity for the entire area. Again, using Google Open Street maps
un-comprehensive housing structure assessment from ap proximately 2013 (HOT
2016) that covered approximately two-thirds of the area and 14.450 housing
structures. This indicates that numbers of approximately 100,000 people have
been driven off their land for that area. Most people found refuge in the south
(in green) that Christian Aid (2002) have assessed to receive approximately
50,000 people by late 2002. Inserted in Figure 3a is a zoom up along the
all-weather road from where specific villages have been reported attacked and
show no longer farming activities in 2002.
Figure
3. Change detection (z-scores) of MaxEnt derived farming activity on a large
scale (from Prins 2018), its detail and collaborate reports of massive
displacement of people from two different periods and events (1999–2002 (a) and
2014–2014 (b)).
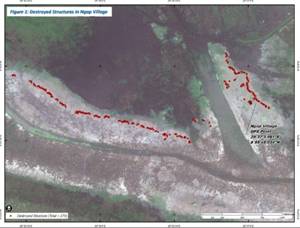
Clip of farming change in the Ngop village area 2014-2015.
Prins 2018 left (figure 3 b) and right VHR image from UNOSAT 2015
counting 250 destroyed structures – see more https://unosat-maps.web.cern.ch/SS/CE20131218SSD/Ngop_UNOSAT_20150518.pdf
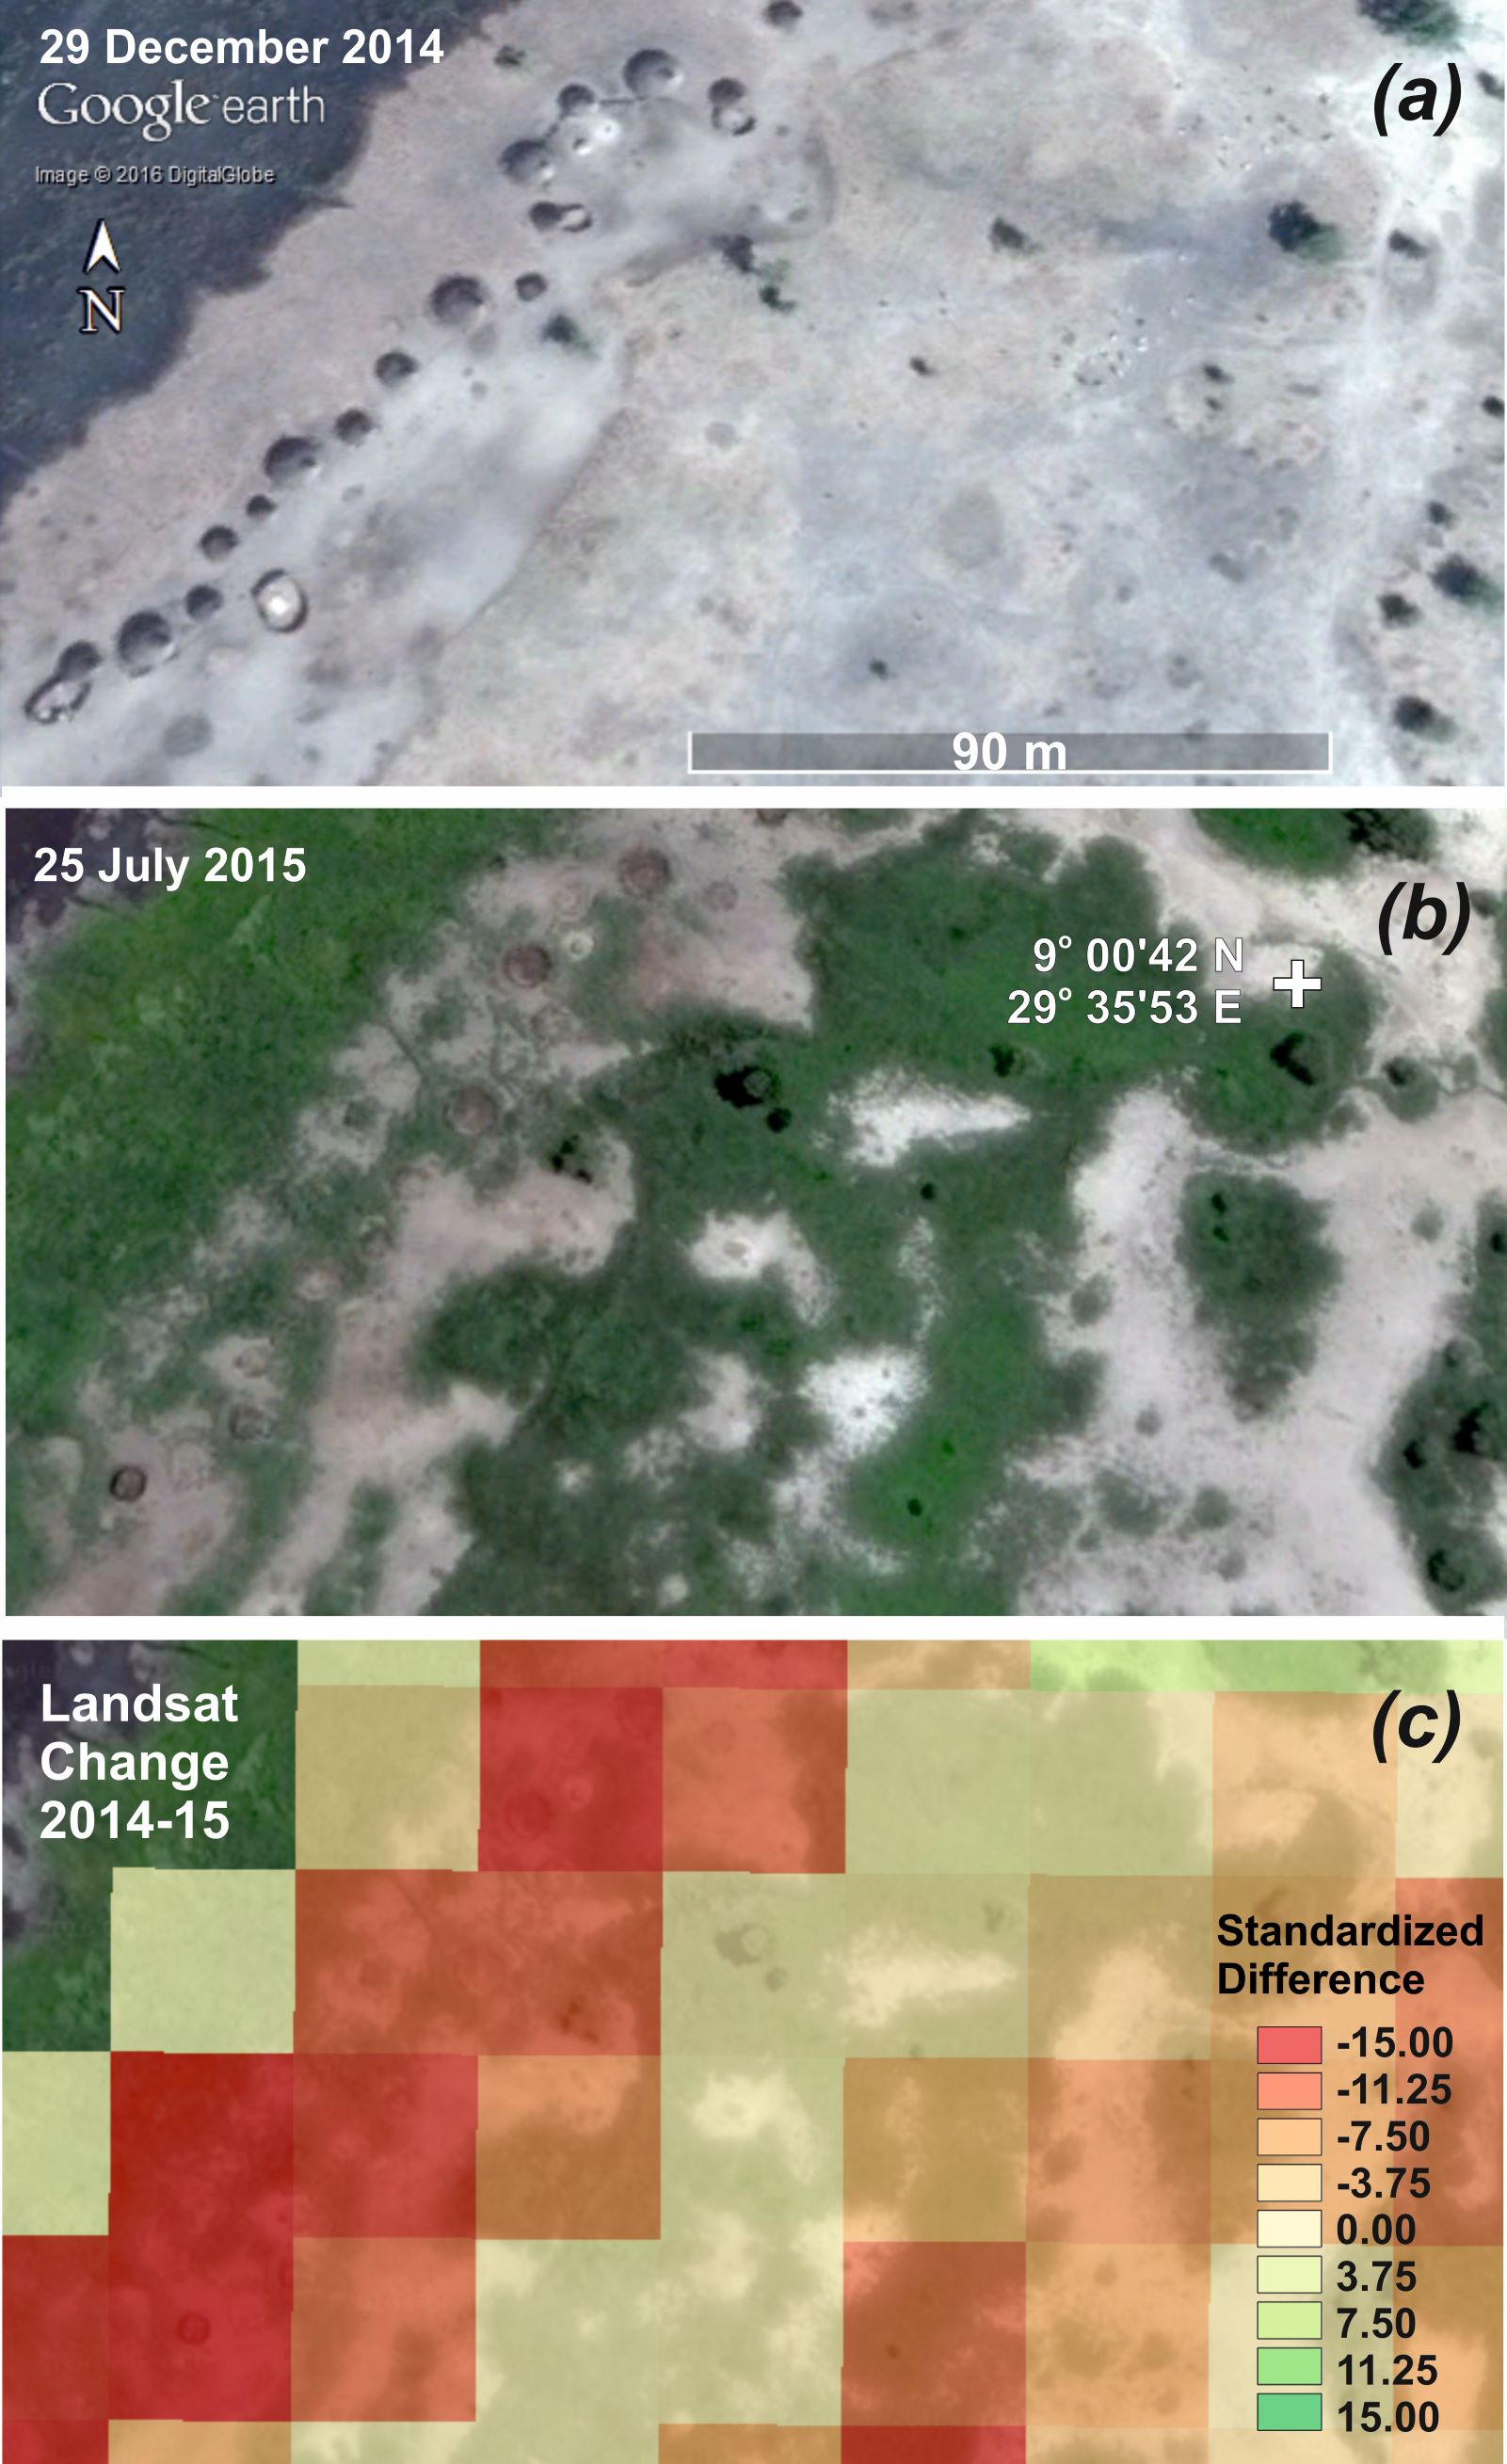
Figure
4. A typical settlement area recorded by VHR imagery in late 2014 (a), cattle’s,
most white, can be seen in upper right part of the image. The same area recorded
7 months later into the wet season. The settlement was destroyed and rapidly
being overgrown (b). The Landsat 2014–15 difference image (z-scores) of farming
activity from MaxEnt shows a strong response to the change at settlement level.
Photo credit (Google Earth).
Figure 5. Change detection of farming activity after harvest in 1999 and 2002.
Based upon ISO classification of calibrated Landsat data (Prins 2018) recorded
the 27. Nov. 1999 and 3. Nov. 2002. The ISO classification was performed with
standard setting in Erdas Imagine - like the Prins 2009 report. The categorical
classifier immediately grabs more of the homestead surroundings than using the
supervised approach with a 10% minimum threshold. This suggest that it
captures farming activity well below the 10% threshold set out in the VHR
verification. In other words, the ISO classifier grabs the effect of farming
activity that are difficult to account for in VHR images interpretations. This
sensitivity is a plausible explanation for why it has for decades been
considered as a stronger classifier than supervised classification to trace the
effect of pastoral farming systems.
VHR imagery has a clear
advantage over Landsat data of being able to check up the status of individual
building structures at any time of the year if the cloud cover permits it.
However, it can be difficult to access if people are present in an area from
just the visual interpretation of VHR imagery using the blue, green and
red-light area. In this case, the spatial and multispectral properties of
Landsat data could show to traced farming activity beyond what could be clearly
interpreted from VHR imagery. This can explain the commission errors (show to
much) by the ISODATA classification that appeared to
be rooted in farming activity below the 10% farming activity threshold used in
this work. This assumption is supported by the categorical classification simply
produces larger homestead areas than those predicted from the highly effective
MaxEnt algorithm that has been entirely trained with higher levels of farming
activity. I all cases the work confirms that ISODATA classification is a useful
application for rapid tracing farming activity in range land environment – if it
is used wisely. As with multispectral crop monitoring, the limitation of the
current method is a time window of few months from where it may work with high
accuracy. Dryness will typically produce increased commission errors further
into the dry season and ‘greening’ will produce omission error in the wet
season. On the other hand, it has been noted (HRW 2003) that during the wet
period, mobility in the area is decreased which limits the humanitarian abuses.
Supplements:
PRINS KEY-NOTE SPEAKER AT THE SWEDISH SPACE DAYS 2013:
Global reporting interpretation of speach
 pdf PRESENTAION OF THE 5A CASE AND ANALYSIS - INVITED TALK REMOTE SENSING DAYS
STOCKHOLM 8 APRIL 2013
pdf PRESENTAION OF THE 5A CASE AND ANALYSIS - INVITED TALK REMOTE SENSING DAYS
STOCKHOLM 8 APRIL 2013
pdf REPORT TO ECOS 2009:
Satellite mapping of land cover and use in relation to Oil exploitation in
concession 5A
Client of the 2009 report: The European Coalition on Oil in Sudan (ECOS)
privacy@prins engineering.com